Discover / The changing game
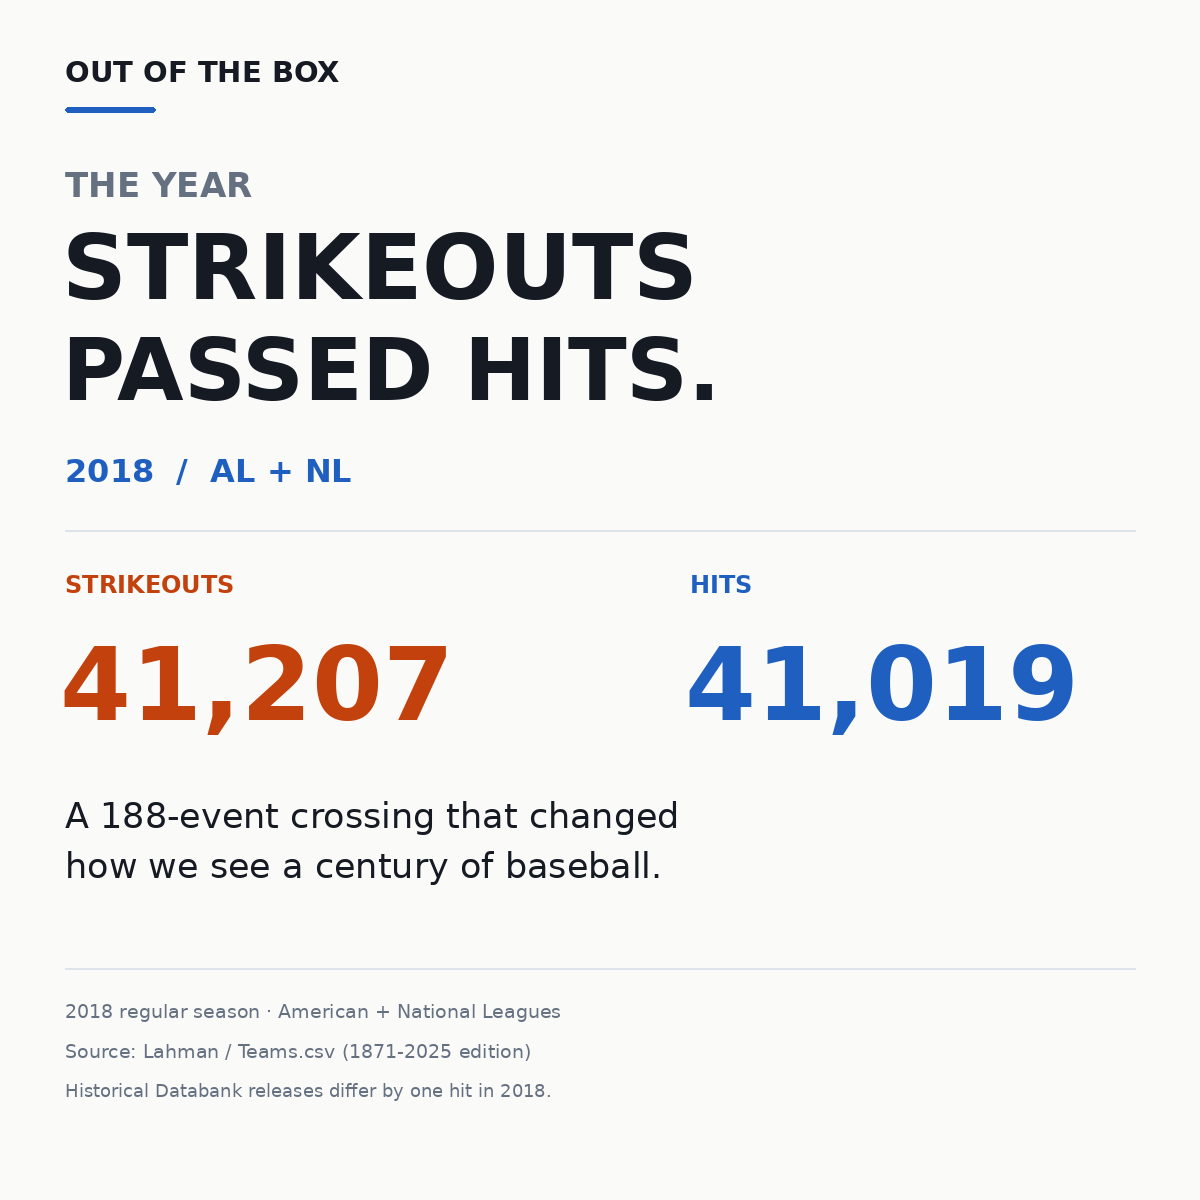
The year strikeouts passed hits.
In 2018, strikeouts exceeded hits in the combined American and National League season totals. Move through the nearby years to see just how narrow the crossing was.
STRIKEOUTS41,207
HITS41,019
+188 strikeouts
AL + NL · Regular season. 2020 was shortened; annual totals aren't directly comparable. Switch to the longer-term exhibit for historical context.
Keep the discovery.
Save the clean graphic or share this interactive view and its receipts.
Receipts / source and limitations
Source: Lahman 1871–2025 Teams.csv, summing each year's American and National League team hitting strikeouts (SO) and hits (H). Values shown for 2014–2025. In 2018: strikeouts 41,207, hits 41,019, difference 188. An older Databank v2021.2 calculation reported 41,018 hits; source revisions differ by one. This exhibit is scoped to the AL and NL.